A leading streaming platform was spending big across paid channels but couldn't tell which ones were actually driving subscribers. We built the measurement framework that answered that — and the reallocations that followed changed everything.
19%CAC reduction after spend reallocation
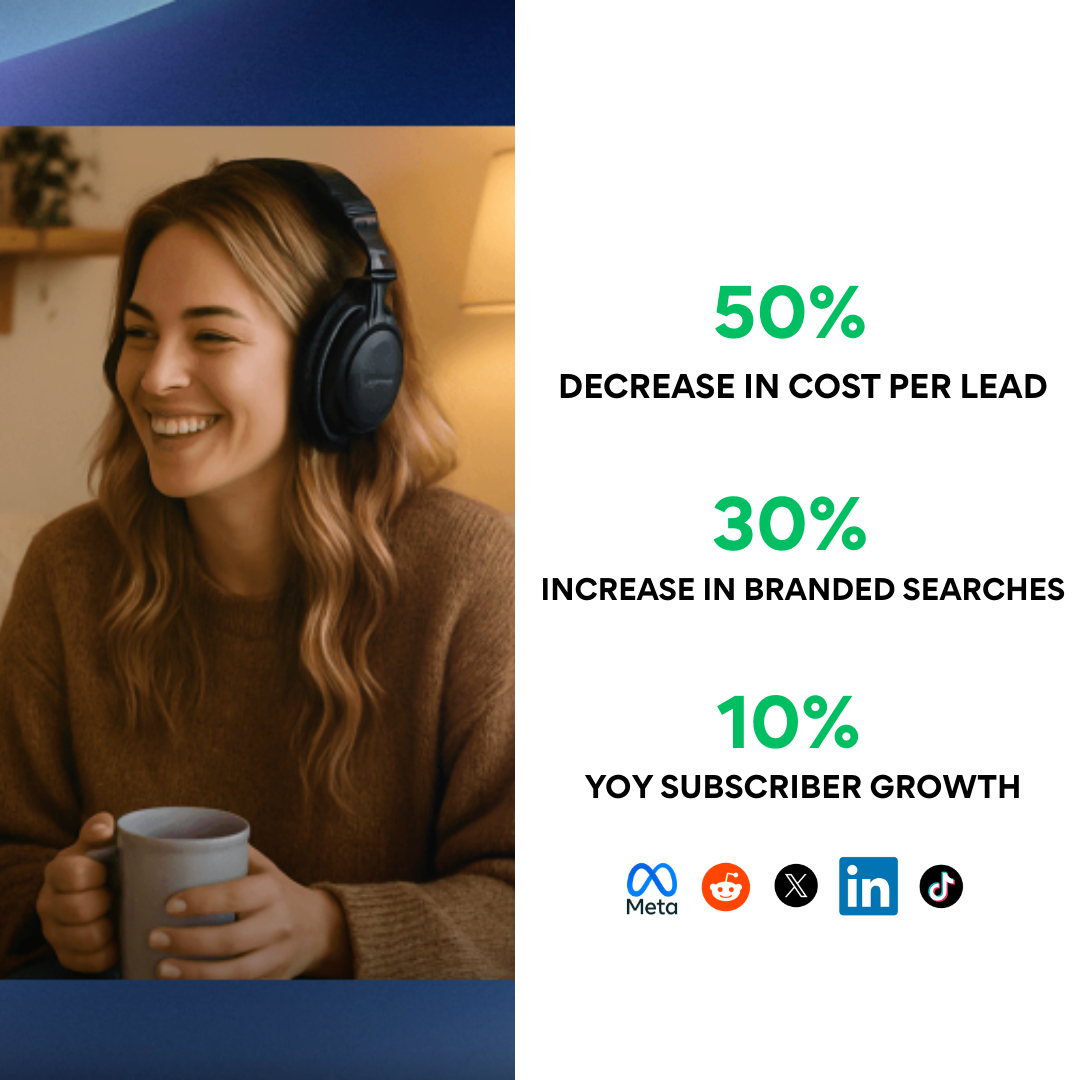
70 wksHighest new subscriber growth rate in 70 weeks
57%More acquisitions from non-brand search, same period YoY
The problem
A leading streaming platform was spending $30–50K per week across paid channels and growing — but standard last-click attribution couldn't tell them which channels were actually driving new subscribers versus just claiming credit for conversions that would have happened anyway.
Branded search looked efficient on paper. A user clicks a branded keyword, converts, and gets counted as a paid acquisition. In reality, that user was going to convert regardless — they already knew the product. The paid click just intercepted an organic journey and charged the business for it. When we modeled the actual CAC on branded search, it was north of $600 per subscriber and consuming nearly half the total paid media budget.
They needed two things: a measurement framework they could actually trust, and a creative strategy that could scale to new regions — Europe, Canada, Australia — without the CAC blowing up in the process.
Restream lets creators broadcast one live feed to 30+ platforms at once — the product behind the subscriber growth.
What we built
A triangulated measurement framework
We built a three-layer measurement stack: Marketing Mix Modeling (MMM) to understand contribution at the channel level, multi-touch attribution (MTA) to track the path to conversion across touchpoints, and incrementality testing to isolate true causal impact from correlation. All three were integrated with subscription data and reactivation data directly — clean inputs produce clean outputs.
This wasn't a dashboard exercise. The purpose was to answer a specific question: which spend is actually moving the subscriber number, and which spend is just showing up near conversions that were already happening?
Incrementality testing to separate causation from correlation
The branded search finding came from incrementality testing — running holdout experiments that temporarily suppressed branded spend in defined markets and measuring what happened to organic conversion volume. The results confirmed what the MMM was suggesting: organic conversions held steady. The branded clicks were intercepting organic journeys, not creating new ones.
The same methodology was applied to paid social to quantify its halo effect on search demand — a line of impact that last-click attribution was completely missing.
Persona-level creative strategy for three audience segments
With the measurement infrastructure in place, we rebuilt the creative strategy from the audience up. Three core segments emerged: Creators (focused on discoverability and reach), Coaches and educators (focused on audience growth and monetization), and Marketing Leaders (focused on multi-platform distribution). Each got distinct messaging, distinct content formats, and distinct lead magnet strategies.
Content assets were built around what each segment actually wanted: creator monetization guides, webinar series on audience growth, competitor comparison frameworks for marketing teams evaluating streaming tools.
Geographic expansion with controlled CAC
European, Canadian, and Australian market expansion required region-specific creative and budget allocation — not a translation of existing US campaigns. Each region got its own audience sizing, CAC targets, and performance benchmarks before budget was scaled. The measurement framework made it possible to expand aggressively without losing visibility into where the spend was actually working.
Key insight
Last-click attribution systematically overvalues branded search because it counts brand-intent clicks as paid acquisitions. The user was coming anyway — the ad just got in the way and took the credit. When you model true incrementality, branded search CAC is often 5–10x higher than it appears on a standard dashboard. For this platform, it was over $600. Cutting it freed budget for channels that were actually growing the subscriber base.
Results
CAC dropped 19% after the branded search reallocation — while YoY subscriber growth simultaneously accelerated from ~9% to 28%
New subscriber growth hit its highest rate in 70 consecutive weeks after the reallocation
Non-brand search acquisitions grew 57% YoY (2,561 → 4,010) while CAC on that channel fell from $430 to $327 — on 18% more spend
At $90K/week in blended spend, CAC landed in the low $60s — a level that typically produces $80s CAC at that scale
Paid social incrementality test confirmed a 6% relative lift in search demand attributable to paid social (p-value 0.004, R² 0.99) — cross-channel halo effect that last-click was missing entirely
Platforms
Reddit AdsMetaLinkedInXGoogleBing
Frequently asked questions
What is Marketing Mix Modeling and why does it matter for SaaS?
Marketing Mix Modeling (MMM) is a statistical method that quantifies the true incremental contribution of each marketing channel. Unlike last-click attribution, MMM accounts for baseline organic conversions and measures what each channel actually adds on top. For SaaS companies with high branded search volume, MMM typically reveals branded search CAC is 3–10x higher than standard reporting shows.
How do you reduce CAC for a SaaS company running paid media at scale?
Start with accurate measurement. For most SaaS companies spending $50K+/month, branded search is significantly overvalued by last-click attribution — 20–40% of those conversions were going to happen organically. Incrementality testing surfaces this. Reallocating that budget to genuinely incremental channels directly reduces blended CAC without cutting overall spend.
What is incrementality testing in paid media?
Incrementality testing measures whether a channel is causing conversions or just appearing near them. A holdout experiment suppresses spend for a defined audience group and compares conversion rates to a control group. The difference — adjusted for statistical significance — is the true incremental lift. It's the most reliable way to separate causation from correlation in paid media attribution.
How much should a SaaS company spend on branded search?
Only enough to defend against competitor bidding on your brand terms. If competitors aren't actively bidding on your brand, branded search has low incrementality — those conversions happen via organic anyway. The key is measuring actual incrementality rather than assuming branded search is efficient because the conversion rate looks high on the dashboard.